


About Aviso
The AI-Guided Revenue Operating System
Aviso natively unifies workflows of modern revenue teams, from deal collaboration to pipeline inspection, conversational and activity intelligence, and predictive forecasting into one workspace.
305
Billion Insights
$800B
Pipeline Managed
$466B
Won Deals
98%+
Forecasting
business goal
Aviso targets and operates in B2B services, where they need flexible and easy customization. The business ask is to simplify the process of.
Search and Locate data
Needful & Helpful Insights
Reports & Analytics

Our stake holders
A sales representative is a primary stakeholder and the user who interacts with the platform on a day-to-day basis. Other stakeholder are.
- Sales Leaders
- Finance Leaders
- Sales Managers

project goal
The main goals of the project
- To strategize the design process and introduce short sprint methods to solve & generate the right user experience.
- To work closely with the Product, Data, and Tech team to bring out more valuable experience.
f1's role
the team f1

f1's role
the team f1
- We all started work in a pod system. We worked across multiple pods to balance the work and understand the whole ecosystem.
- Activity & Relationship Intelligence, Conversational Intelligence, User Coaching, etc. are some of the pods that our team has worked around.
- The tasks/features/experience we worked on were generally 1 to 2-week sprint setups and based on the requirement used to change.
- In recent times, the team played a key role in Rethinking the User Experience and Re-designing the platform.
Initial Thought Process
our thought process
The fundamental goal was to identify the pain points of a sales representative and other stakeholders by interviewing them. Also, to collaborate & understand parts of the current platform and the flow of different functionalities.
What problems we actually solved by this exercise?
There are 2 problems statement we focused on
- Better accesibility the components in the platform
- At most amount of data visibility that should not be compromised at any level.
What we did
Recommended platform structure...

What we did
Recommended platform structure...
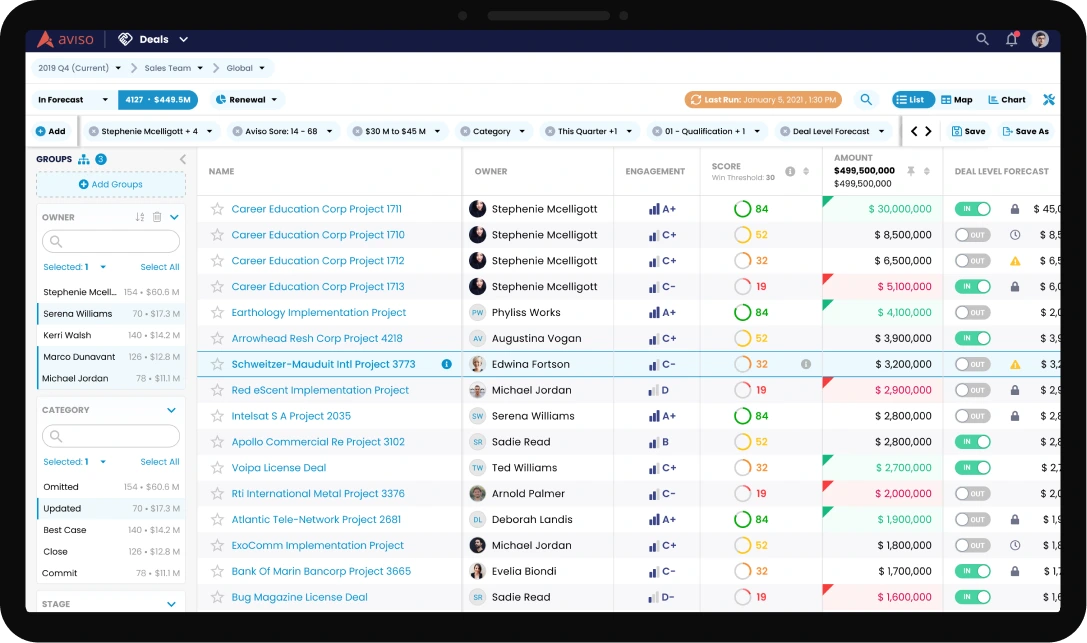
The platform have 5 major components Filters, Views, Groups, Grid & Side panes.
- Filters here play an important role to find the right data at the point in time. These are also used to create a view set that can be saved and used in the future if needed same set of filters to be applied. The user is also allowed to set a View as the default. In the current platform, Filters are not directly visible to users which creates confusion.
- Groups are formed based on a set of filters which is executed on the grid in a form of a query for example Find XYZ from column A where row N holds the value 10.
- Side Pane are for AI Insights and Details that are generated or fetched from CRM. This is to help the user make the right decision in the real world.


UI Mockups
Visual design - Main Deliverables

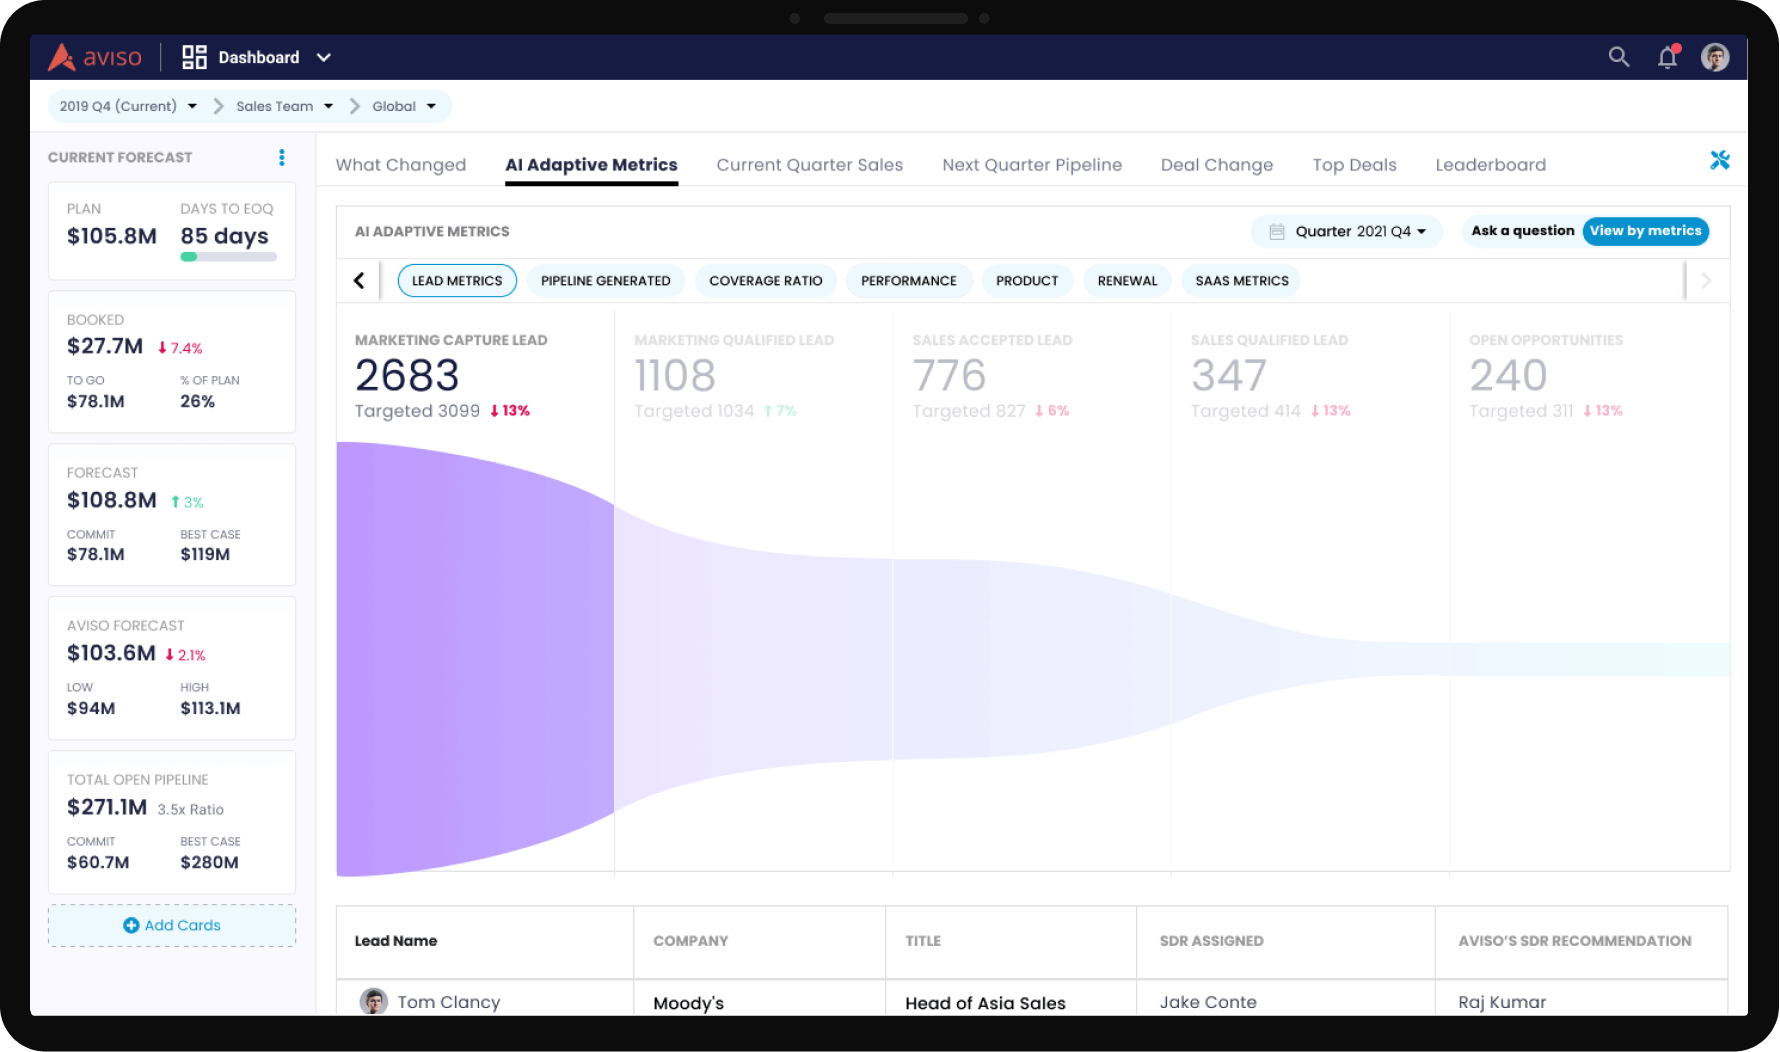
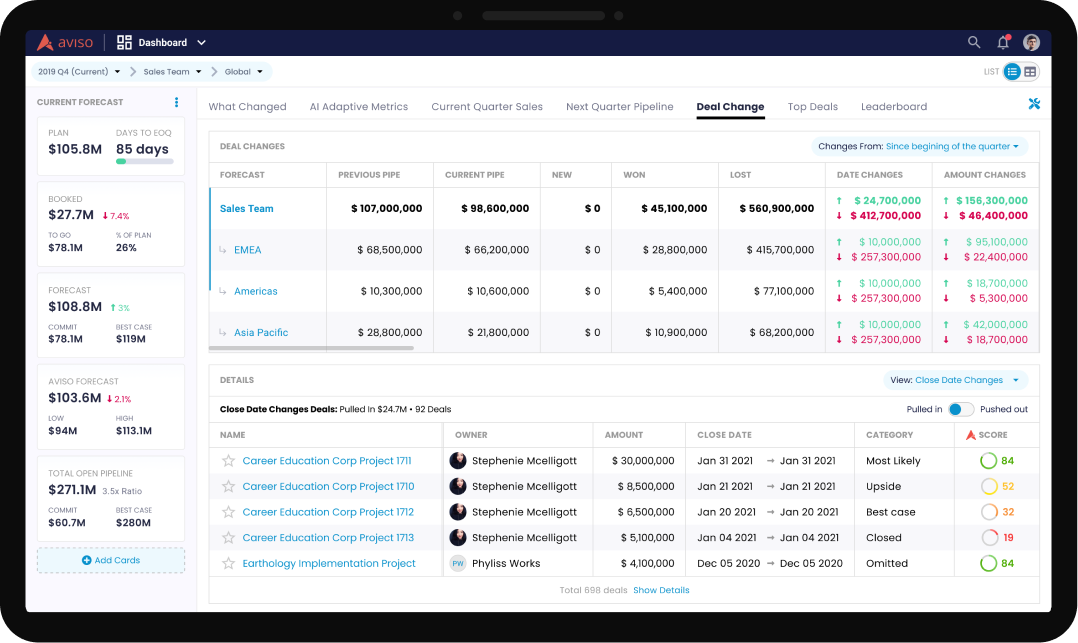
Dashboard
A right mix of graphical and tabular summary of the performance of sales team. Which provide information the managers and respresentative understant the health of their business.


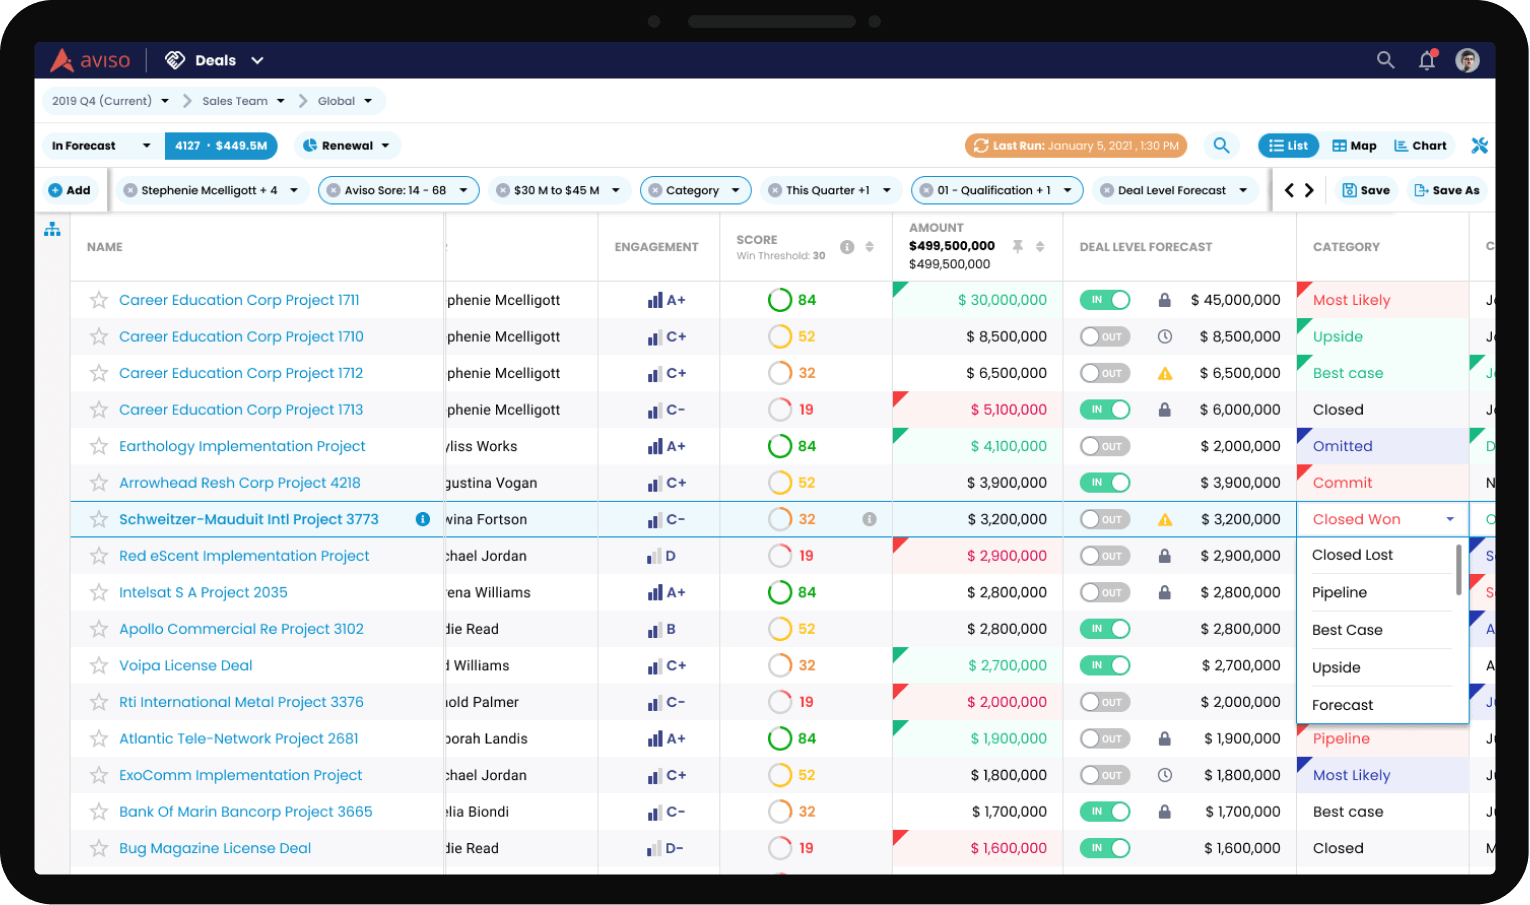
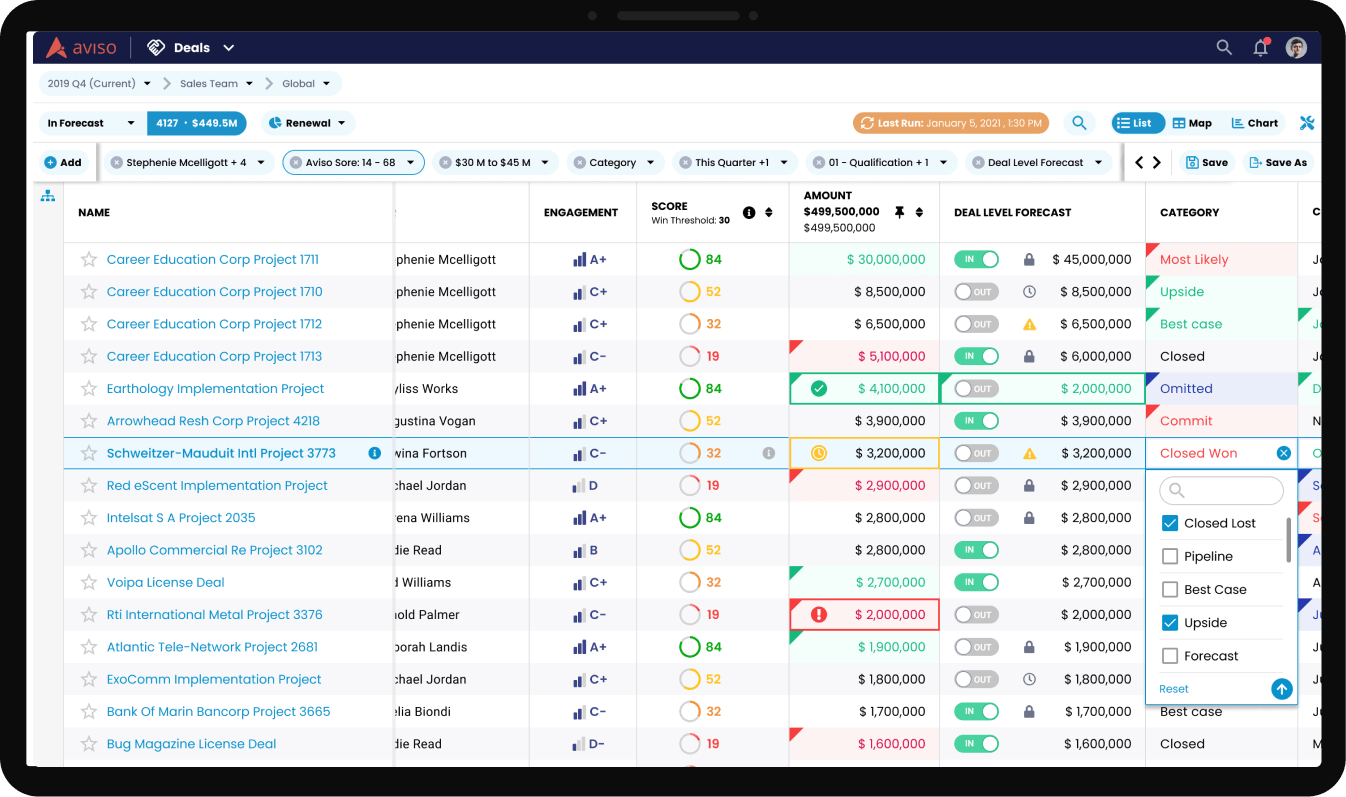
Deals
An heavily loaded grid with designed to help users to view the right set of deals from different CRM's based on the selected Filters & Groups in a tabular form.

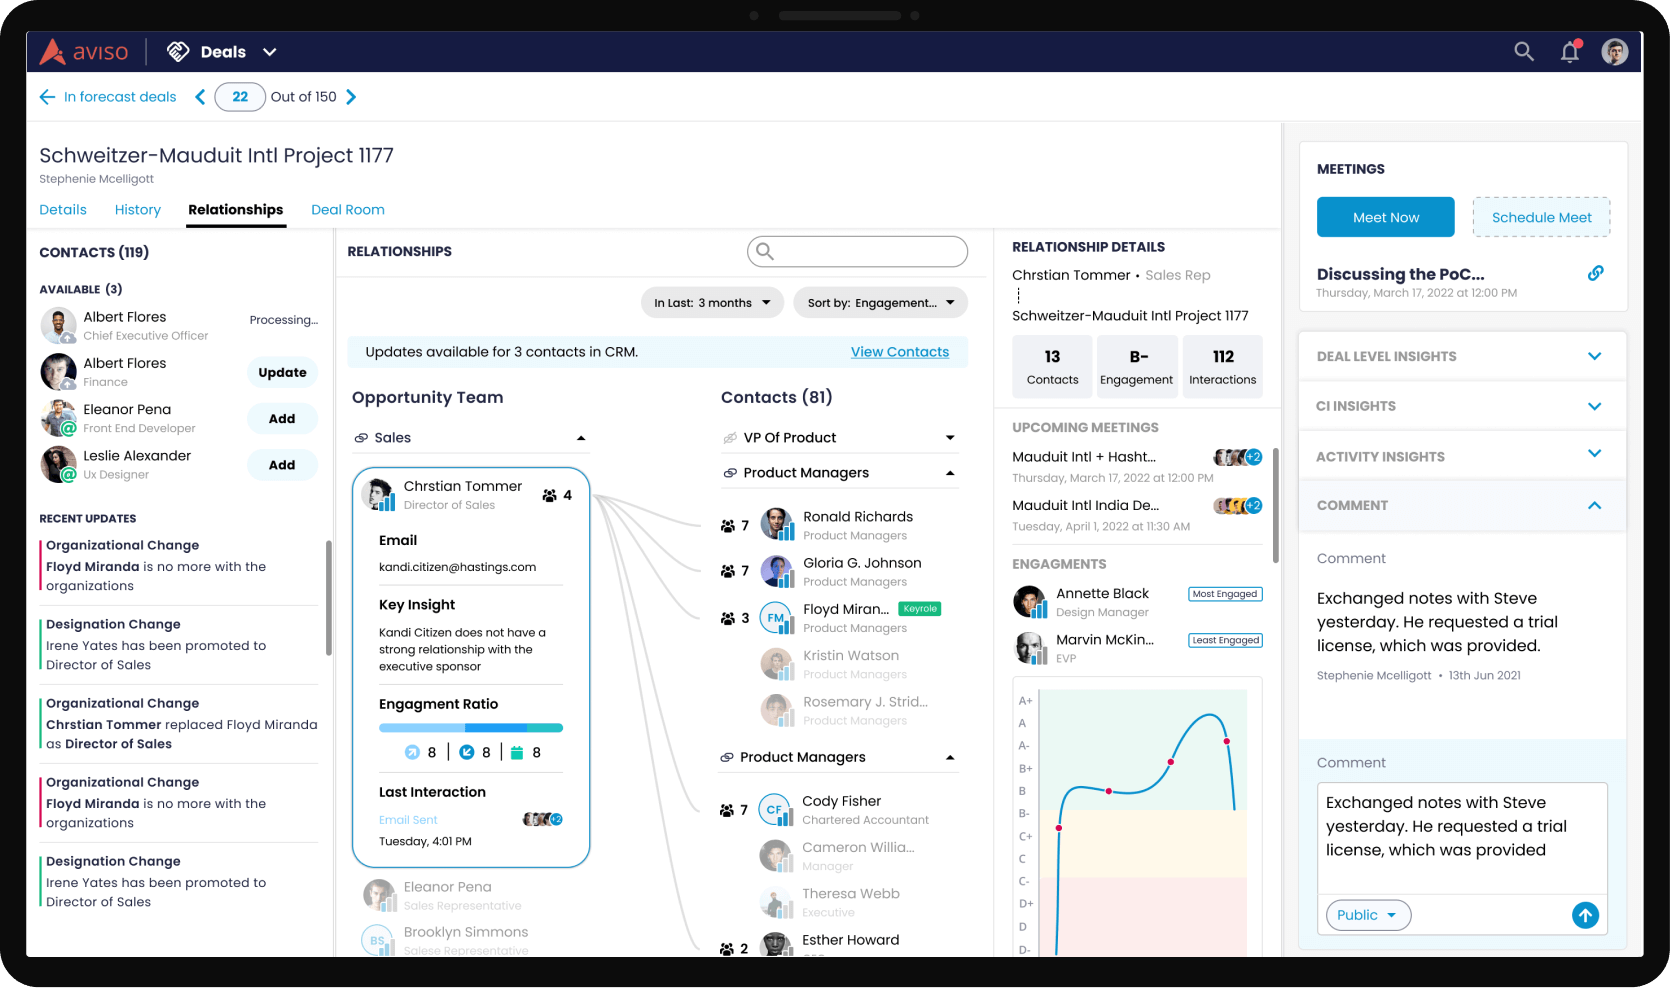
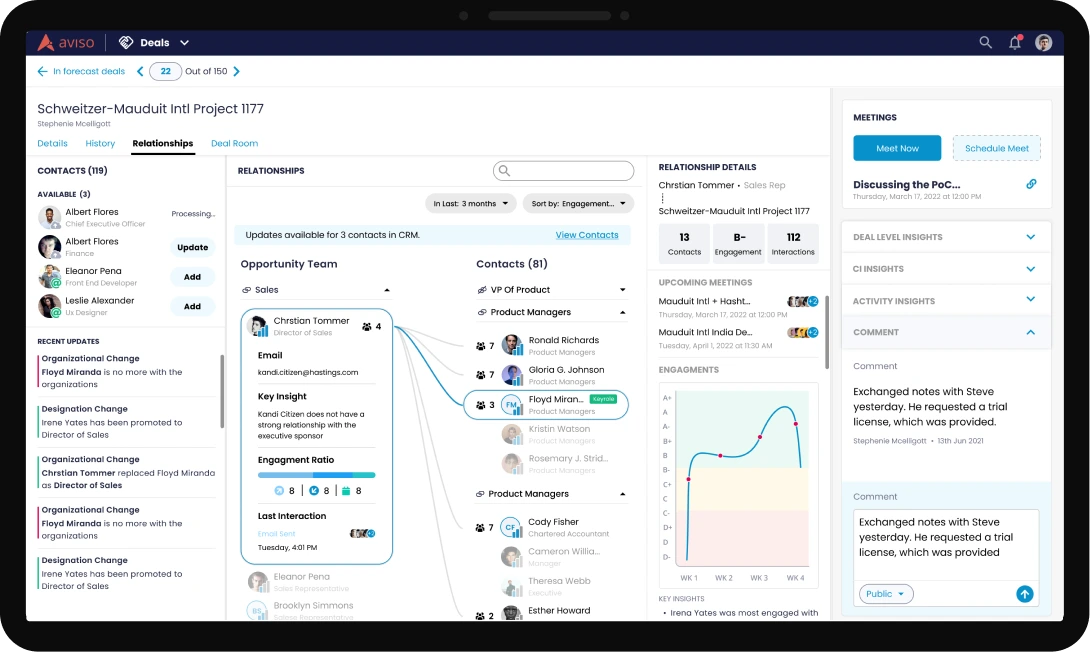
Deal card - Relationship
Deal card holds all the information with respect to the perticular deal. Displaying information like Details, History, Relationships & Collaborations rooms.


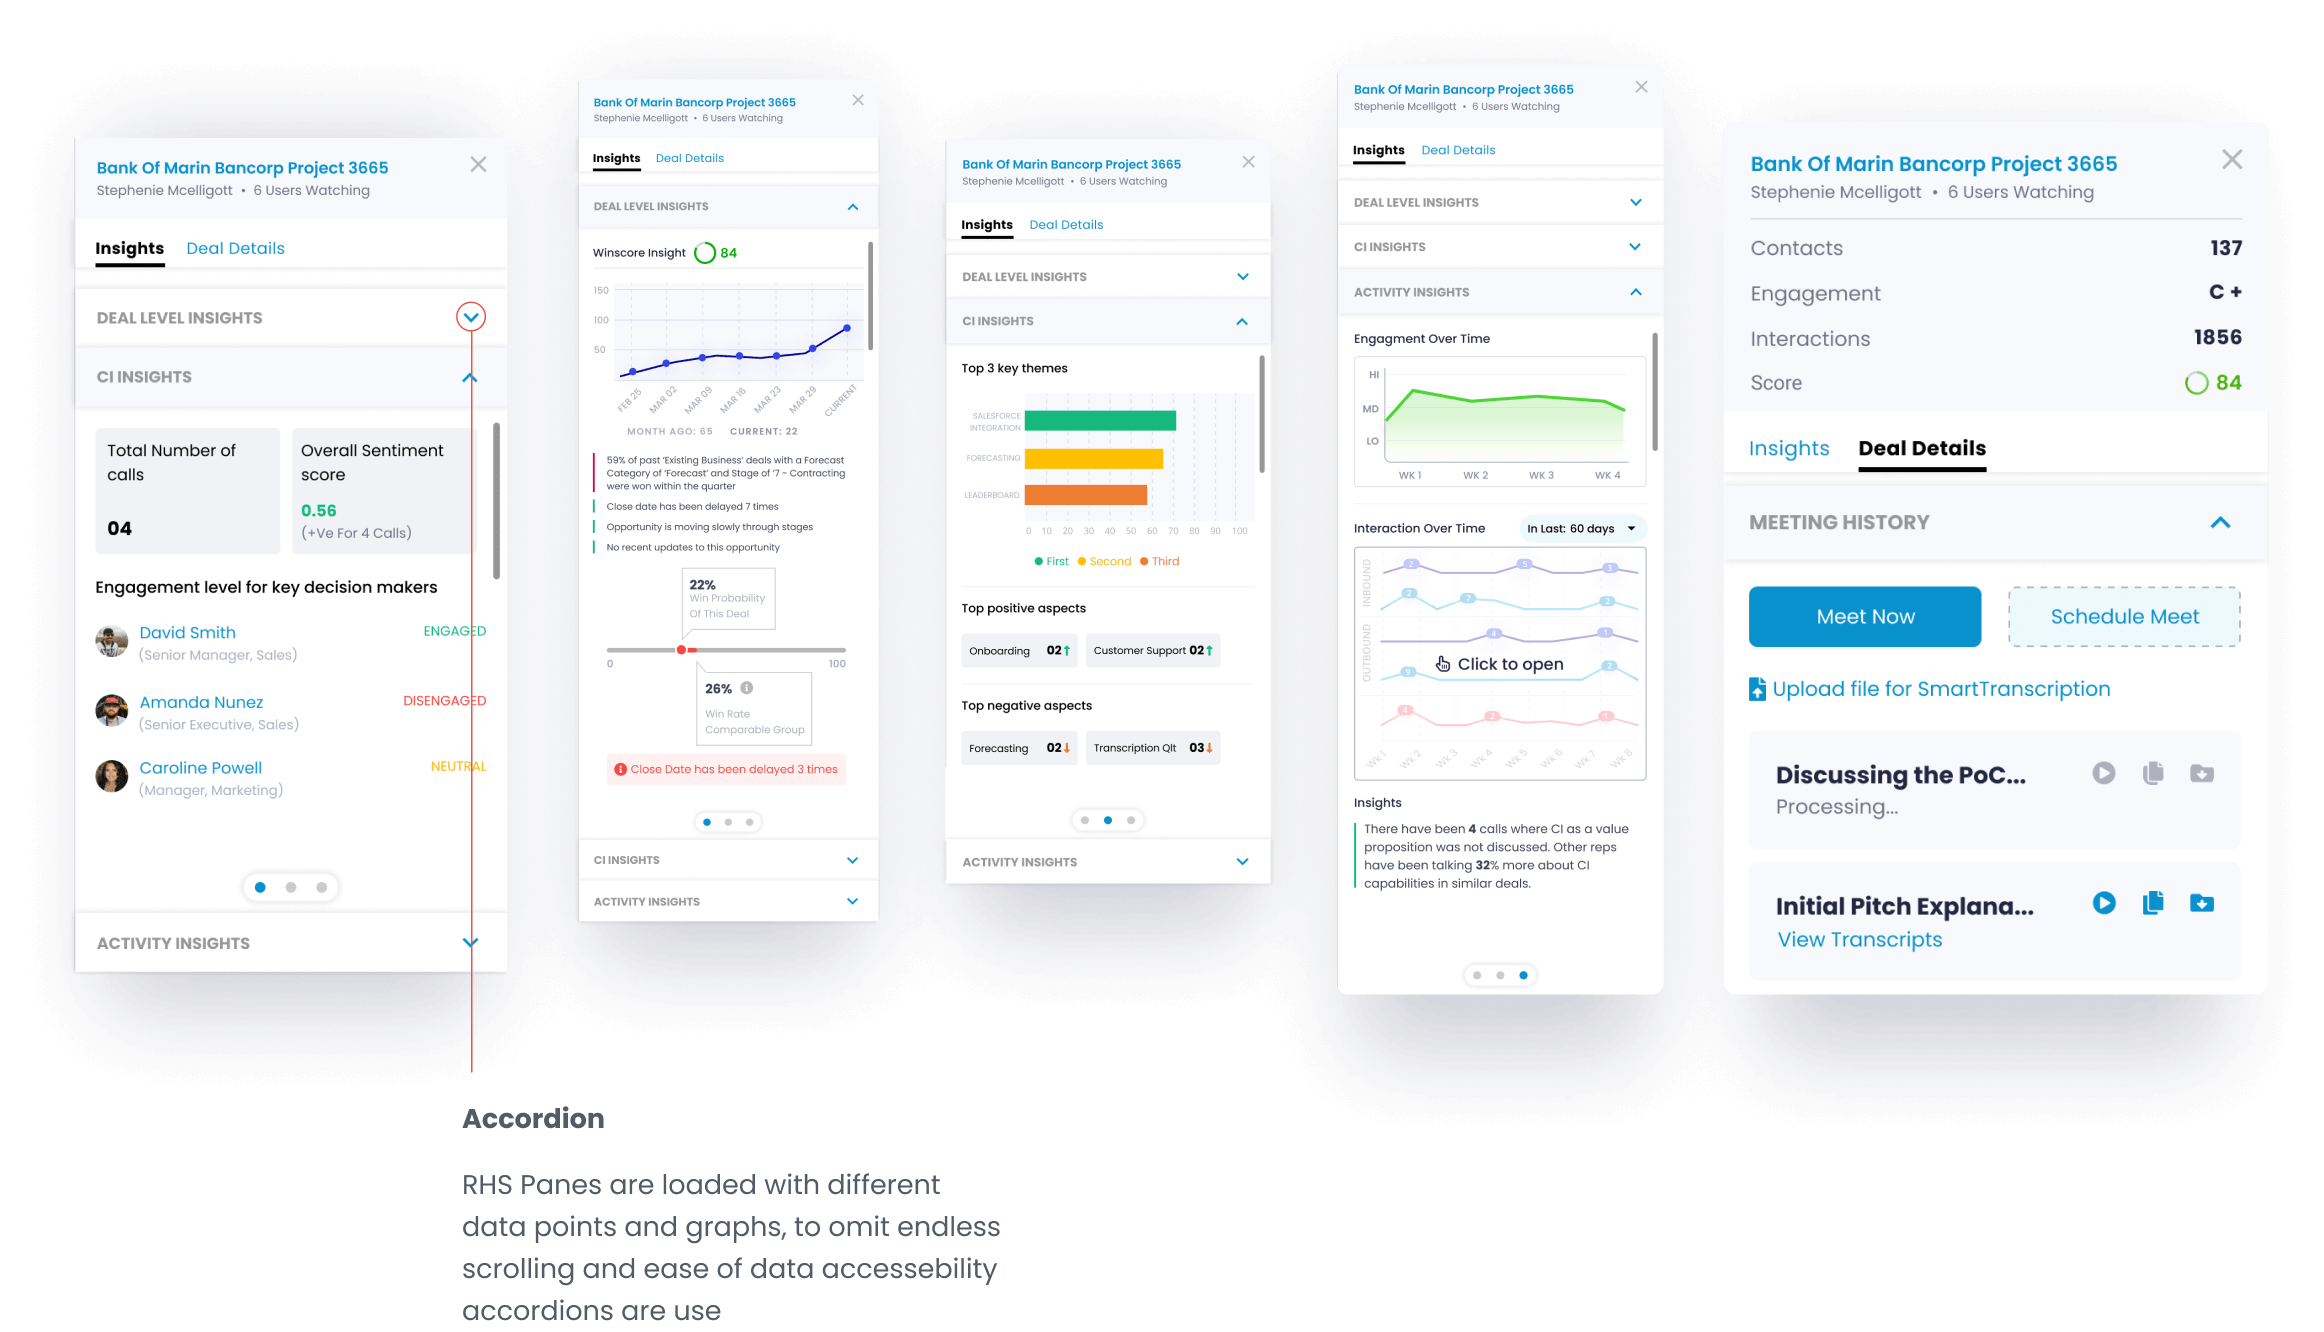
Accordion
RHS Panes are loaded with different data points and graphs, to omit endless scrolling and ease of data accessebility accordions are use

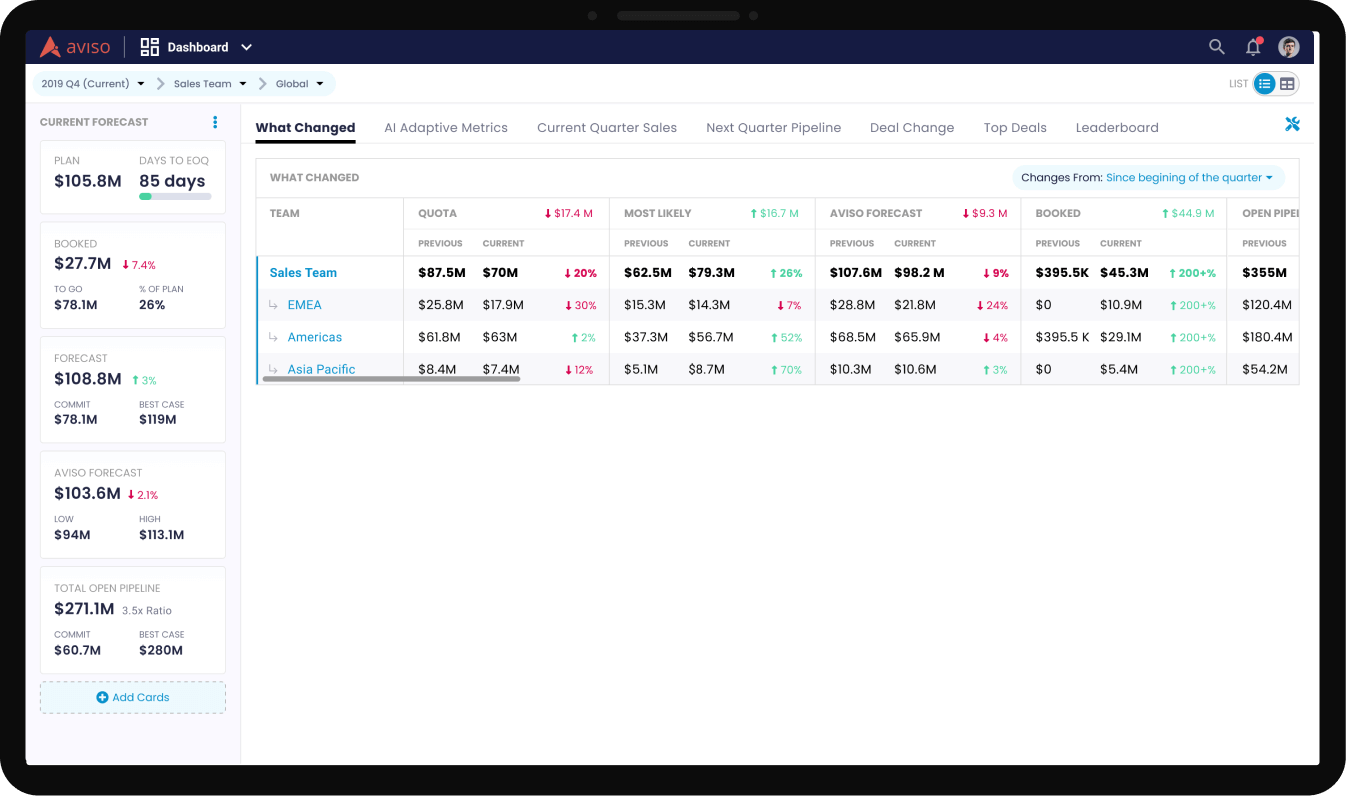
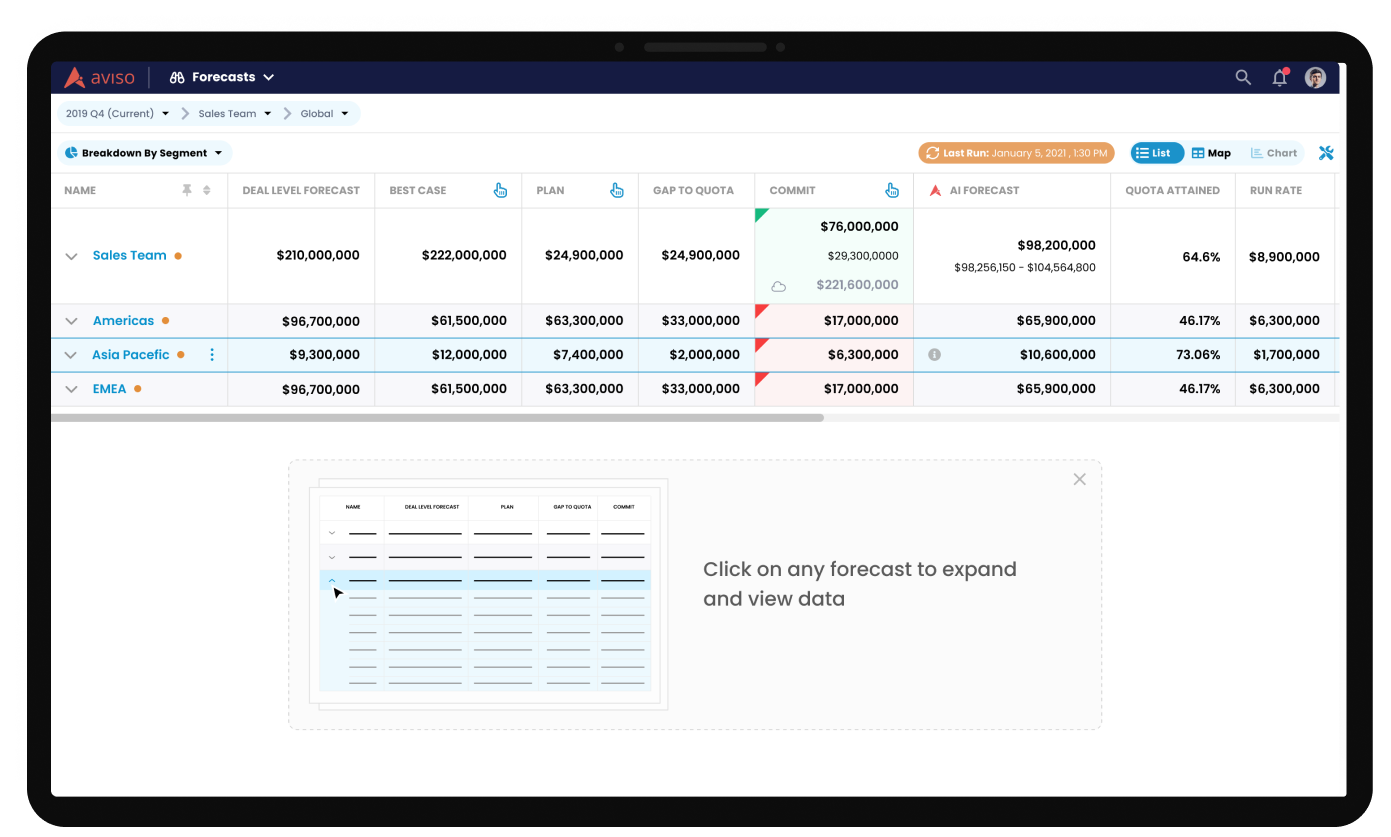
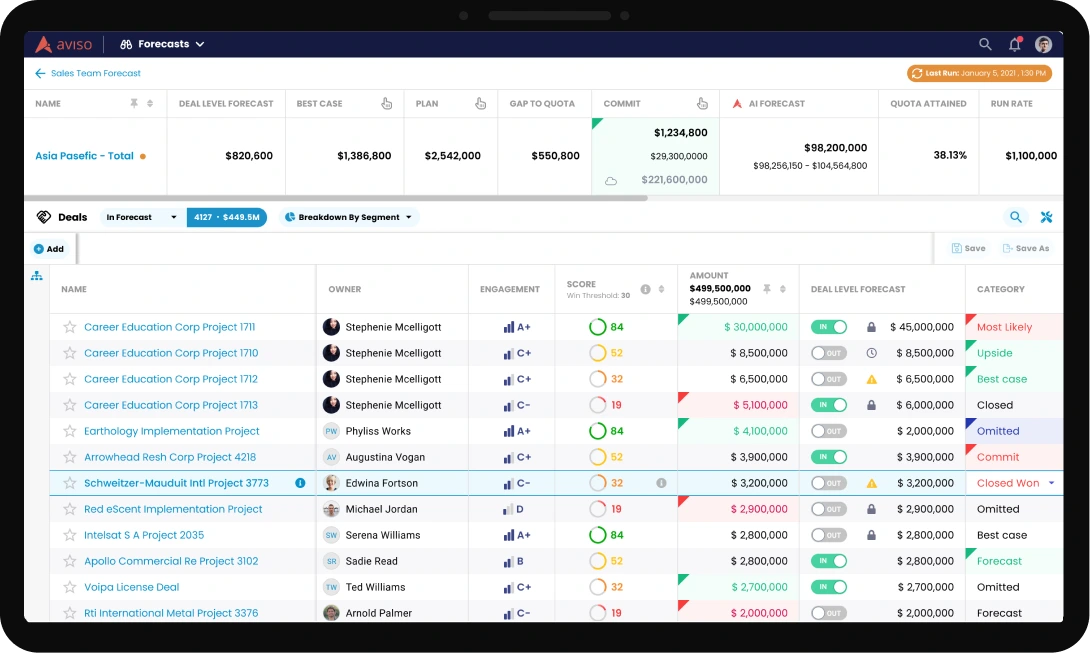
Forecast
Forecasting can be done from a higher level like team to a individual level, where one can select as specific result and view all the related deal data. And so the dual table view was design that servers the purpose.


Conclusion
We collaborated to discover, identify, ideate & conceptualise to create the right experience and this will continue to design and deliver upcoming projects with AVISO.


Start Your Journey with Us
Schedule a Meeting
Frequently Asked Questions
For Projects, Call
For Job Enquiries, Call
