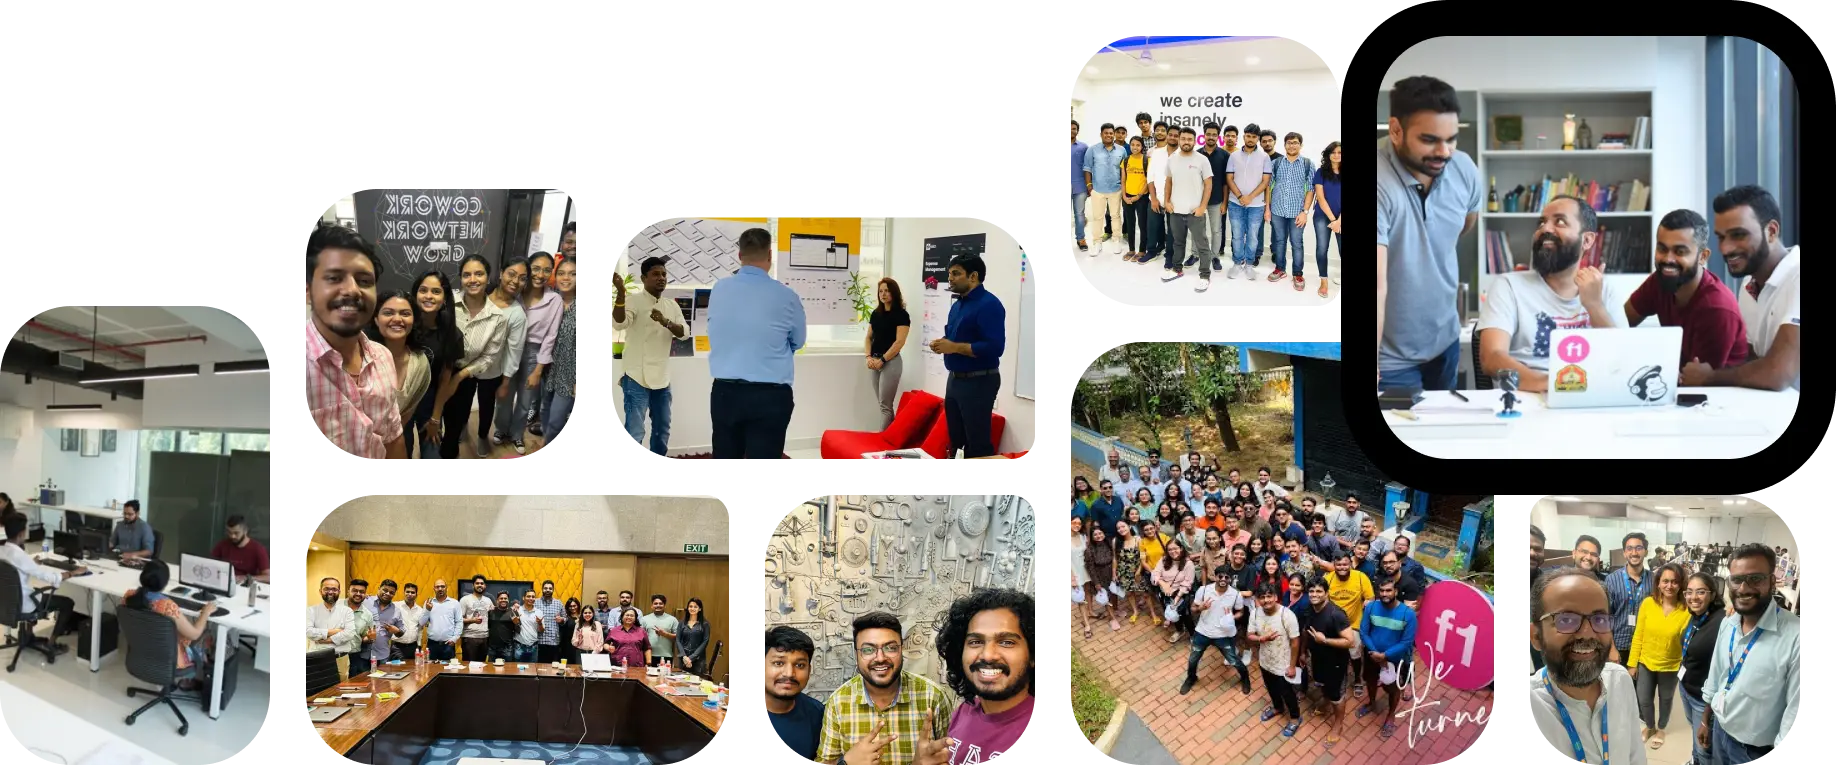
Why choose us?
We work with your Product and UX teams to offer your product the much-needed dependability and predictability.

Stunning

Impactful

Innovative
Stunning
Impactful
Innovative
What is the impact of Data Visualization on Enterprise growth?
Data visualization accelerates Enterprise Growth by transforming complex datasets into Predictive User Interfaces that facilitate rapid decision-making. Backed by 13+ years of experience, f1studioz humanizes machine intelligence through design-led storytelling, helping global partners like Deutsche Telekom and ICICI Bank achieve up to an 80% increase in user adoption and 98%+ forecasting accuracy. By streamlining complex workflows into intuitive dashboards, we reduce cognitive load and turn raw data into strategic business assets.
Enhanced Understanding
Data, when turned into compelling narratives, can engage users & meet business goals. We help you create interactive websites, & conversational interfaces that lead to increased conversions.
Impactful Storytelling
We give voice to your data, fostering the growth of your business. Our data visualization services can help you strike that necessary balance between form and function.
Exceptional Design Thinking
We help you meet the ever-evolving demands of your users through our data visualization services like product conceptualization, user-friendly platforms, increased usability, etc.
Effortless Connectivity
We strive to give character to your numbers. Our data visualization team helps you manage user experience across verticals like in-store, online, or mobile and converse with them in an effective manner.
Why Do We Need Data Visualization?
In an era of information overload, raw data is only as valuable as the insights you can extract from it. Enterprises need Data Visualization to turn "noise" into a strategic business asset that drives growth and clarity.
Enhanced Understanding & Rapid Synthesis
Compelling Narratives: When data is turned into a story, it engages users more deeply and meets business goals faster.
Interactive Conversational Interfaces: We create platforms that lead to increased conversions by making data easy to explore.
Impactful Storytelling for Stakeholders
Business Growth: By giving a "voice" to your data, we foster the growth of your enterprise.
Strategic Balance: Effective visualization strikes the necessary balance between form and function, making complex reports digestible for C-suite leaders.
Design Thinking for Modern Scalability
User-Centric Platforms: We help you meet ever-evolving user demands through product conceptualization and increased usability.
Exceptional UX: Using Design Thinking, we ensure that high-level analytics are accessible to all team members, not just specialists.
Effortless Connectivity Across Channels
Character in Numbers: We strive to give character to your numbers, managing the User Experience across all verticals, including in-store, online, and mobile.
Effective Conversation: Professional visualization allows you to converse with your audience in a more effective, data-backed manner.
Our Core Data Visualization Services
At f1studioz, we bridge the gap between complex data and human decision-making through four specialized pillars:

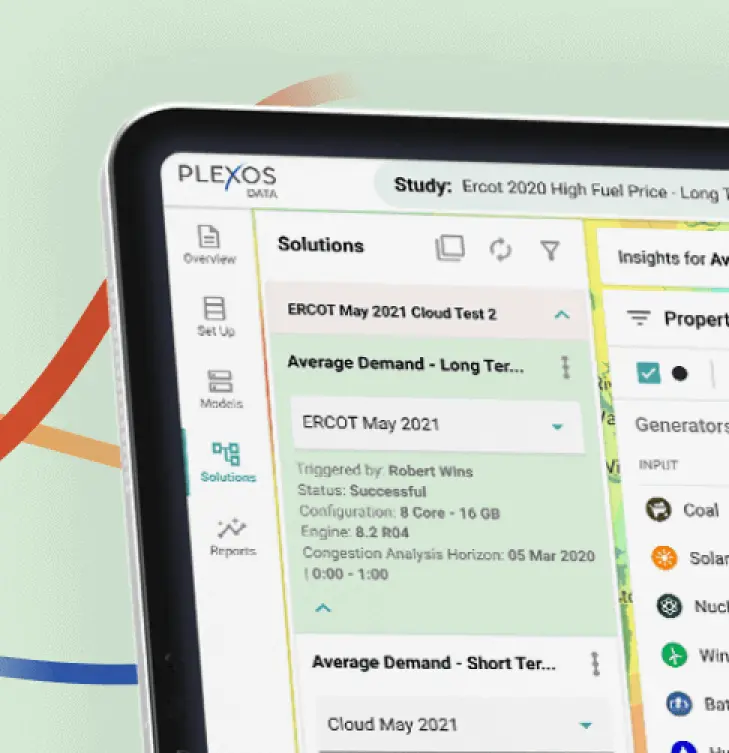
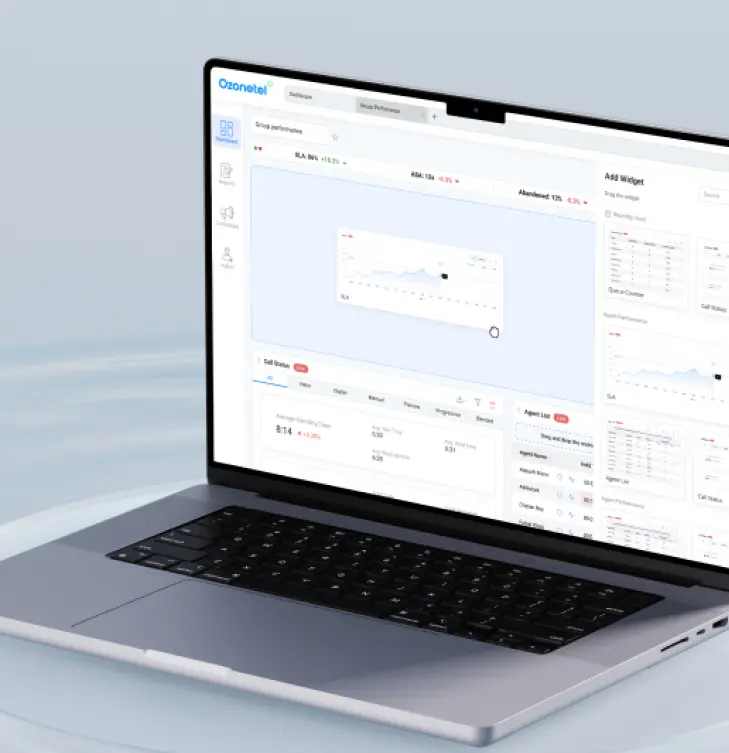
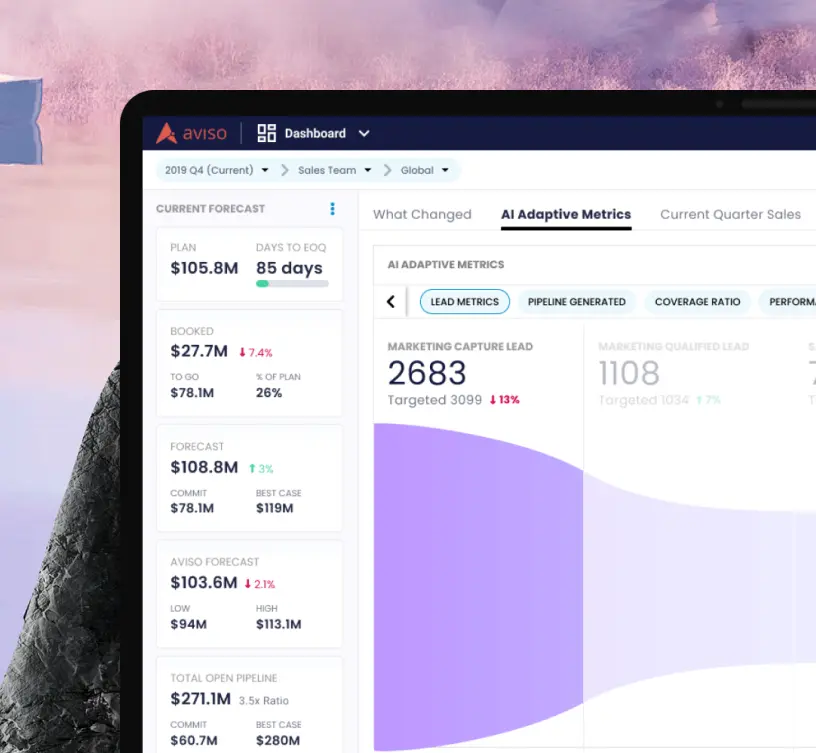
Dashboard UX & UI Design
Our design team focuses on humanizing AI by crafting high-efficiency, predictive interfaces for complex enterprise dashboards. We specialize in creating tailor-made analytics and intuitive interactions that ensure users find value and efficiency in every click, making smart data accessible to every level of the organization.
UX Research & Strategy
Every project is built on data-driven foundations, where we utilize heuristic analysis and user testing to uncover hidden patterns within your datasets. By mapping the user journey and treating data as our compass, we build intuitive pathways that lead your team directly to the most valuable business insights.
Front-End Engineering
We ensure pixel-perfect implementation by leveraging deep expertise in modern frameworks like React, Angular, and Vue.js to maintain design fidelity. Our engineering approach prioritizes cross-platform scalability, managing seamless user experiences across mobile, online, and in-store verticals to ensure performance at scale.
Conversational & Accessible AI
We streamline consumer workflows by integrating natural language queries, allowing users to effectively "talk" to their data for immediate answers. At the same time, we prioritize UX for Accessibility, ensuring that our inclusive design process makes data visualizations readable and usable for everyone.
How we Craft UX Our Process
Intrigued by our work, Interested to know how we roll?

Crafting Clarity from Complexity

Understanding Your Data
Our journey begins with an in-depth analysis of your data. We delve into the numbers, patterns, and relationships, ensuring a solid foundation for impactful visualization.

Designing the User Journey
Data serves as our compass, while design acts as the map. We skilfully navigate users through the data landscape, constructing intuitive pathways that seamlessly lead them to valuable insights.

Visual Storytelling
Our UX design process is steeped in storytelling. We infuse the data with visual elements that not only represent numbers but also evoke emotions and understanding.
Iterative Refinement
We believe in the power of iteration. Through constant testing and refinement, we fine-tune the visuals, ensuring they resonate with your audience and convey precise meaning.
Why Choose f1studioz for Data Visualization?

13+ Years of Enterprise Mastery
A decade of experience transforming complex data for global leaders like Deutsche Telekom, ICICI Bank, and The Home Depot.

Proven Impact on User Adoption
Our design-led approach has delivered up to an 80% increase in user adoption and 98%+ forecasting accuracy for enterprise partners.

Pioneers in Humanizing AI
We specialize in UX for AI, creating predictive interfaces and conversational layers that make machine intelligence accessible to everyone.
Scalable Engineering Excellence
Deep expertise in React, Angular, and Vue.js, managing high-scale platforms with over 1,000 components and 305 billion insights.

ROI-Driven Design Thinking
We bridge the gap between machine intelligence and human action, reducing cognitive load to drive faster, data-backed decisions.
Our 4-Step "Crafting Clarity" Process
Data Analysis &
Relationship Mapping
We begin by analyzing numbers and patterns to build a solid foundation for impactful visualization. This ensures every design choice is rooted in your data's unique relationships.
Strategic User
Journey Design
Using data as our compass, we construct intuitive pathways that lead users directly to valuable insights. We navigate the complex data landscape to simplify the decision-making process.
Visual Storytelling &
Humanizing AI
We infuse UI elements with meaning, going beyond simple numbers to evoke understanding and clarity. This "narrative-first" approach ensures your data speaks a language humans can act upon.
Iterative Refinement &
Execution
Through constant testing and fine-tuning, we ensure visuals resonate with your audience and convey precise meaning. Our expertise in React, Angular, and Vue.js guarantees pixel-perfect execution across all platforms.
Taking digital experiences to the next level

Why customers
like us?

Well, we will let our clients answer that question for us :)


Working with f1Studioz is like collaborating with a high-performance team — you get the best output in the shortest amount of time.
Ruchit Garg
Founder and CEO, HFN


It was an amazing experience working with f1studioz. I really enjoyed working with f1studioz
Anjali Kumari
Head Product, Capillary (former)


In a short time, they have demonstrated phenomenal understanding of our technology
Manoj Saxena
Chairman, CognitiveScale
Working with f1Studioz is like collaborating with a high-performance team — you get the best output in the shortest amount of time.
Ruchit Garg
Founder and CEO, HFN
It was an amazing experience working with f1studioz. I really enjoyed working with f1studioz
Anjali Kumari
Head Product, Capillary (former)
In a short time, they have demonstrated phenomenal understanding of our technology
Manoj Saxena
Chairman, CognitiveScale
Build your
future with us!
As an equal opportunities employer, we're committed to fostering growth and diversity.